1.6.4 Lasso (L1, α = 1)
Source: "glmnet/examples/02-lasso.rkt"
The lasso is the elastic net at α = 1: a pure L1 penalty. Where ridge shrinks every coefficient but keeps them all, the lasso performs variable selection: it drives coefficients exactly to zero, more of them as λ grows. It is the model to reach for when you believe only a few predictors matter and you want the fit to say which.
1.6.4.1 The data
The same fixture as Ridge regression (L2, α = 0): the response is exactly y = 1 + 2x₁ − x₂, and x₃ = x₁² is irrelevant.
> (define X '((1.0 2.0 1.0) (2.0 1.0 4.0) (3.0 4.0 9.0) (4.0 3.0 16.0) (5.0 6.0 25.0) (6.0 5.0 36.0))) > (define y '(1.0 4.0 3.0 6.0 5.0 8.0))
1.6.4.2 Fitting
lasso is elnet-fit with #:alpha 1.0. coef gives the intercept β₀ and then the coefficients β, here shown to three decimals:
> (define fit (lasso X y #:lambda 0.05)) > (displayln (coef-line (coef fit))) β₀ = 1.000, β = (1.829 -0.829 0.000)
The coefficient of x₃ is exactly zero: the irrelevant predictor has been selected out, while x₁ and x₂ keep their signs, a little shrunk. The predictors a fit kept are those with a nonzero coefficient. Since the intercept comes first, the coefficients start at index 1, which is also the number of their predictor:
> (define kept (for/list ([b (in-vector (coef fit) 1)] [j (in-naturals 1)] #:unless (zero? b)) j)) > kept '(1 2)
1.6.4.3 The selection path
elnet-path fits a list of λ in one call, largest first (Regularization paths). in-path walks it, giving each λ with its coefficients, and deviance-ratio gives the path’s R² at each λ. Read upward, raising λ removes predictors one at a time:
> (define path (elnet-path X y #:lambda '(0.01 0.05 0.2 0.5 1.0 2.5)))
> (for ([(λ coefs) (in-path path)] [r² (in-vector (deviance-ratio path))]) (printf "λ = ~a: ~a, R² = ~a\n" λ (coef-line coefs) (fmt r²)))
λ = 2.5: β₀ = 4.500, β = (0.000 0.000 0.000), R² = 0.000
λ = 1.0: β₀ = 2.449, β = (0.586 0.000 0.000), R² = 0.611
λ = 0.5: β₀ = 1.425, β = (0.879 0.000 0.000), R² = 0.763
λ = 0.2: β₀ = 1.000, β = (1.317 -0.317 0.000), R² = 0.905
λ = 0.05: β₀ = 1.000, β = (1.829 -0.829 0.000), R² = 0.994
λ = 0.01: β₀ = 1.009, β = (1.960 -0.966 0.001), R² = 1.000
At λ = 0.01 all three predictors are in (the noise just barely); by λ = 0.05 x₃ is out; by λ = 0.5 x₂ is out; and at λ = 2.5 nothing is left. Once every coefficient is zero the fit is the intercept alone, which is the mean of the response:
> (displayln (coef-line (coef (lasso X y #:lambda 2.5)))) β₀ = 4.500, β = (0.000 0.000 0.000)
plot-coefficient-path, from glmnet/plot, draws the same path as R’s plot(fit, label = TRUE) does (Coefficient paths): one curve per predictor against −log λ, so that the largest λ is at the left, with the count of nonzero coefficients along the top:
> (require glmnet/plot) > (plot-coefficient-path path #:label #t)
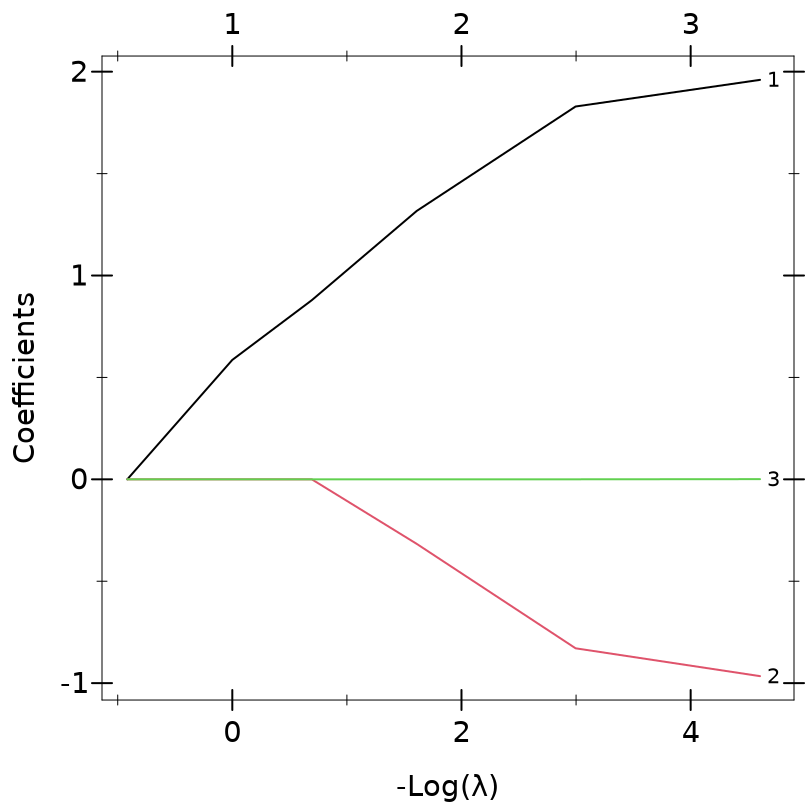
Read from the left, the plot is the table read from the top: x₁ enters at λ = 1, x₂ at λ = 0.2, and x₃ only at the smallest λ, 0.01, with a coefficient too small to lift its curve visibly off zero, although the count along the top reaches 3.
1.6.4.4 Choosing λ by cross-validation
Six observations without noise are no test of λ: with no noise to overfit, the smallest λ predicts best. With noisy data, cross-validation chooses λ by how well each fit predicts observations it did not see (Choosing λ by cross-validation). Here are 40 observations of the same model, with uniform noise on [−1, 1] added to y, as rows X40 and responses y40:
> (random-seed 3) > (define (uniform a b) (+ a (* (- b a) (random))))
> (define-values (x₁ x₂) (for/lists (x₁ x₂) ([_ (in-range 40)]) (values (uniform 0 6) (uniform 0 6)))) > (define X40 (map list x₁ x₂ (map sqr x₁)))
> (define y40 (for/list ([a (in-list x₁)] [b (in-list x₂)]) (+ 1.0 (* 2 a) (- b) (uniform -1 1))))
elnet-cv cross-validates the lasso path on them, and coef reads the coefficients at either λ it chose:
> (define cv (elnet-cv X40 y40)) > cv
#<glmnet-cv:gaussian
Measure: Mean-Squared Error
Lambda Index Measure SE Nonzero
min 0.01703 56 0.3378 0.05704 2
1se 0.14472 33 0.3890 0.06871 2>
> (printf "lambda-min: ~a\n" (coef-line (coef cv #:lambda 'lambda-min))) lambda-min: β₀ = 1.182, β = (2.017 -1.061 0.000)
> (printf "lambda-1se: ~a\n" (coef-line (coef cv))) lambda-1se: β₀ = 1.097, β = (1.917 -0.949 0.000)
Both choices keep x₁ and x₂ and drop x₃. coef defaults to lambda-1se, the larger λ, whose coefficients are shrunk further from the true 2 and −1 in exchange for a model the data cannot tell apart from the best one.
plot-cv draws the cross-validated error as R’s plot(cvfit) does (Cross-validation curves):
> (plot-cv cv)
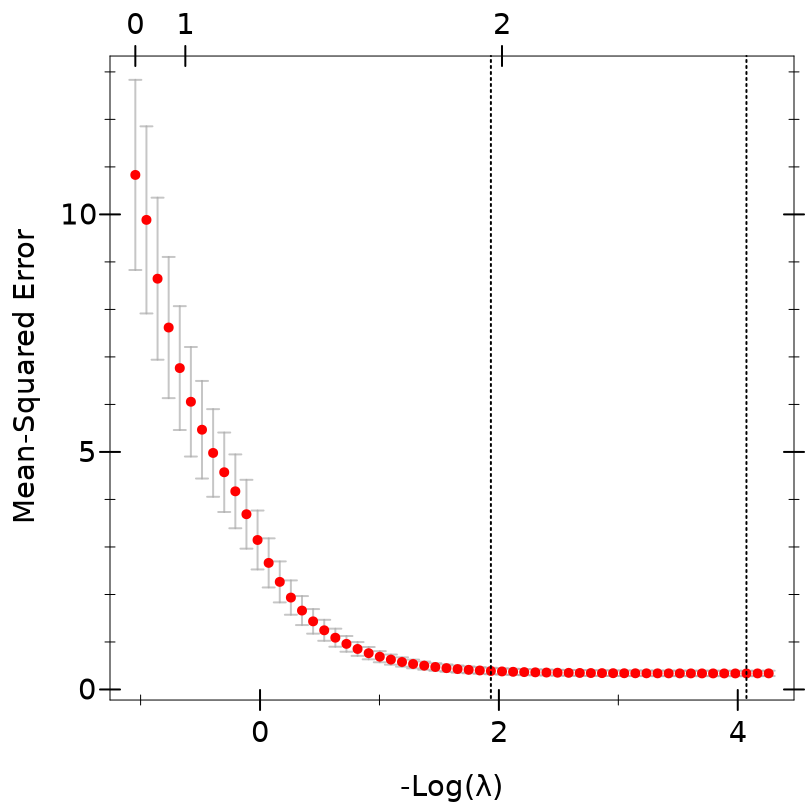
The red points are the error at each λ, with bars one standard error either side, and the dotted lines mark lambda-min, at the right, and lambda-1se, at the left. From lambda-1se rightwards every point lies within one standard error of the smallest error.
1.6.4.5 When to use it
Use the lasso when you expect a sparse answer and want an interpretable list of predictors. Its weakness is correlated predictors: among a group that carries the same signal it tends to keep one arbitrarily and drop the rest. Elastic net (0 < α < 1) shows the problem and the fix.