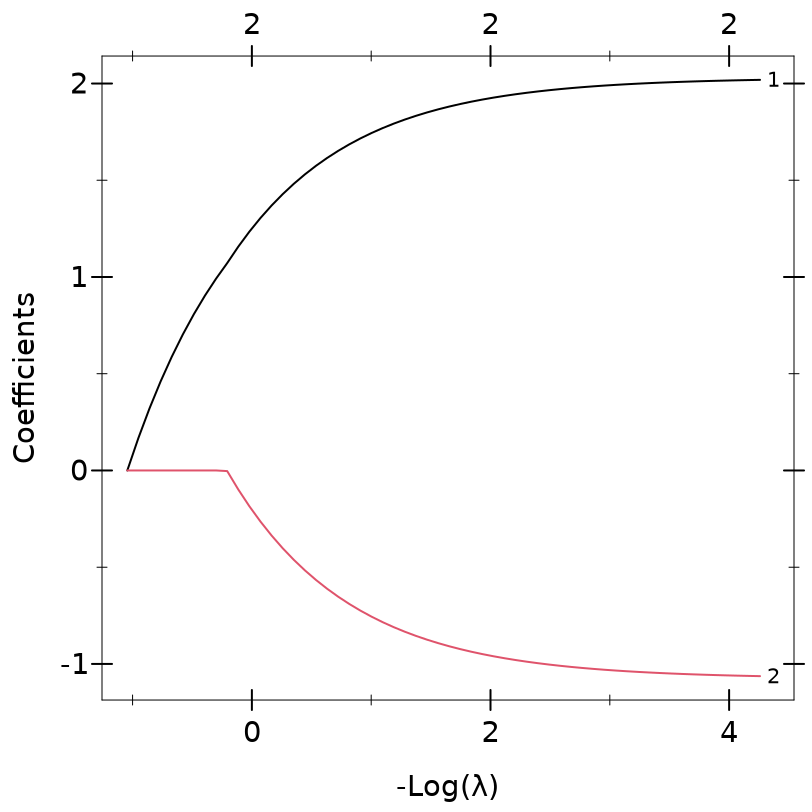
1.5.2 Cross-validation curves
The lasso example cross-validates X40 and y40, 40 observations of the fixture’s model with noise added to y (see Choosing λ by cross-validation).
plot-cv plots the result of elnet-cv as R’s plot(cvfit) does:
> (define cv (elnet-cv X40 y40)) > (plot-cv cv)
To read it:
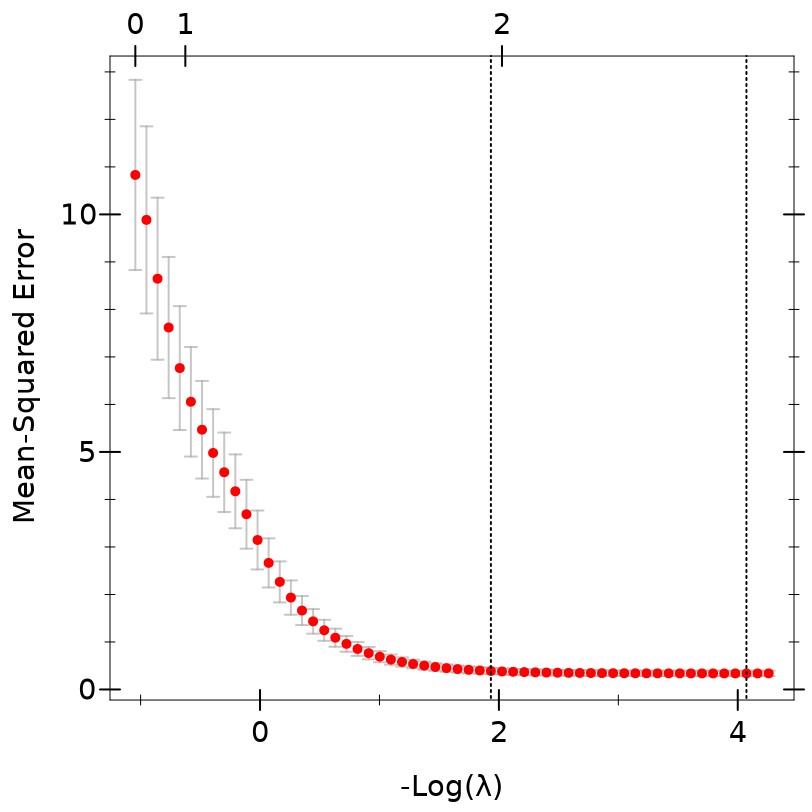
The red points are the cross-validated error, glmnet-cv-cvm, at each λ, and the grey bars reach from glmnet-cv-cvlo to glmnet-cv-cvup, one standard error either side. The y axis is labelled with R’s name for the measure, glmnet-cv-name.
The x axis is −log λ, as in the path plot: heavy regularization at the left.
The dotted lines mark the two choices. The right-hand one is lambda-min, where the error is smallest; the left-hand one is lambda-1se, the largest λ whose error is within one standard error of that smallest error.
The axis along the top counts the nonzero coefficients, from glmnet-cv-nzero.
The error falls steeply while x₁ and x₂ enter, then flattens. From lambda-1se rightwards the curve stays within one standard error of its minimum, so the data cannot tell those models apart from the best one. lambda-1se is the simplest of them, which is why R’s predict and coef use it by default.
plot-coefficient-path plots the path of a glmnet-cv, the path fitted to all the data:
> (plot-coefficient-path cv #:label #t)